")
Cataract indicators: their development and use over the last 30 years
Related content

How do we know if our cataract service is reaching enough (and the right) people? How can we tell whether the quality of surgery is good enough? Understanding cataract indicators, and how to use them, can help us to meet the community’s needs.
For the last four to five decades, cataract has been the most common cause of blindness worldwide; it is also a leading cause of visual impairment. Before this, fewer people grew old enough to develop cataract and infectious diseases (trachoma, onchocerciasis, measles) were thought to cause most blindness. Thanks to improved hygiene, antibiotics, ivermectin, vaccinations and vitamin A distribution, eye infections and xerophthalmia have become less common. At the same time, life expectancy increased, leading to a rapid increase in the incidence (i.e. new cases) of cataract. Because the incidence of cataract increases exponentially with increasing age, the age composition of the population determines the number of new cases of cataract; i.e., countries with older populations tend to have more people with cataract.
Several important advances in cataract surgery took place over the past 30 years, including the advent of microsurgery, the introduction of IOLs, and the transition from intra-capsular to extra-capsular and then small incision surgery. These advances allowed surgery to be undertaken earlier and vastly improved postoperative visual outcomes, which led to an increased demand for services. In parallel with these improvements, the indicators for monitoring services – and the tools to collect monitoring data – have also developed. In this article we describe these developments, and also discuss how to interpret and use indicators to improve cataract services.
Quantity of cataract surgery
When addressing cataract blindness became a priority, the focus was on increasing the number of cataract operations. Cataract surgical rate (CSR) was the first cataract indicator commonly reported. By recording all cataract operations, the total output of cataract operations in a year in a defined population (hospital catchment, district, province or country) can be determined, and trends over time followed.1 CSR is obtained when the cataract output in a given year is divided by the number of people (in millions) in the defined area.
Cataract surgical rate (CSR) = number of cataract operations per million population per year
It is important to monitor CSR for a whole year rather than part of a year, so any seasonal variations in demand for services are accounted for.
The CSR can be as high as 10,000 in some developed market economies, and less than 1,000 in some countries with a young population and/or inadequate eye care services.
A target CSR can be established based on the desired output of the available cataract surgeons in the area, or on the estimated incidence2 of operable cataract.
Because the incidence of cataract is lower in countries with a younger population and a lower life expectancy, the target CSR will be lower there as well.
The number of operations can be used to set and monitor output targets and compare the efficiency of cataract services and surgeons in different hospitals or geographic areas. For example:
- Average weekly output per cataract surgeon: the total number of cataract operations divided by the total number of cataract surgeons in the same area, divided by the number of weeks in a working year.
- Annual output per cataract surgeon: the total number of cataract operations per individual cataract surgeon within a 12-month period.
Quality of cataract surgery
As surgical techniques have advanced, publications from leading eye hospitals reported ever-improving outcomes. However, many eye surgeons worldwide currently work under less favourable conditions and their results are seldom published. In the late 1990s, some population-based surveys showed that up to 40% of operated patients could not see 6/60 after cataract surgery.3 In response, the World Health Organisation (WHO) published recommendations on the outcome of cataract surgery in 1998 (Table 1). According to the WHO, fewer than 5% of cataract patients should be unable to see 6/60 (best corrected or presenting).4
Table 1 WHO guidelines on visual outcome of cataract surgery 6–12 weeks post-operatively4
| Postoperative visual acuity (VA) threshold | Target for the proportion of operated eyes achieving VA thresholds – Presenting visual acuity (PVA) or VA with available correction | Target for the proportion of operated eyes achieving VA thresholds – Best corrected visual acuity (BCVA) or VA with pinhole |
|---|---|---|
| Good 6/18 or better | >80% | >90% |
| Borderline <6/18 – 6/60 | <15% | <5% |
| Poor Worse than 6/60 | <5% | <5% |
The indicator for the quality of cataract surgery is cataract surgical outcome (CSO), which is the visual outcome in the operated eye.
Cataract surgical outcome (CSO) = visual acuity in the operated eye
Paper-based and computerised software tools were subsequently developed to monitor cataract surgical outcome on a routine basis.5,6 The following information is recorded for each operation:
- Visual acuity (VA) before surgery
- Surgical technique used
- Whether the outcome is good, borderline or poor, both after surgery and at follow-up
- The type of complication, if any
- The major cause of each poor outcome.
The proportion of good, borderline or poor outcomes and the proportion of complications can be calculated. In the software tools, filters can be applied to the dates, surgeon, clinic and other parameters to make more detailed analysis possible. The software is intended to provide insight as to where and how modifications in the service can be made to improve visual outcome further.
The system is definitely not intended to compare individual eye surgeons or clinics, but to monitor improvement in outcome over time for the same surgeon or clinic. Unfortunately, many ophthalmologists have been reluctant to use the monitoring tools available, and we must identify and overcome the barriers to incorporating monitoring of outcomes into routine practice.
Population-based indicators
As cataract services continued to develop, it became clear that population-based information was needed that could capture local variations in disease pattern, environment and available resources. It was equally important to gather information on the population, rather than only those who were accessing services. Cross-sectional surveys can provide this information on the eye care situation within a defined area, such as a district, province or country. The information can then be used to plan and monitor services.
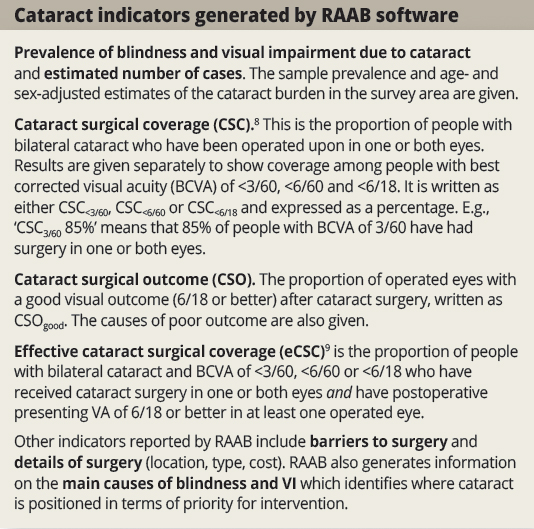
The rapid assessment of avoidable blindness (RAAB) methodology was specifically developed to collect data that would make it possible to plan eye care services for a population of between 0.5 and 5 million people. RAAB surveys are restricted to those aged 50 years and above, where the prevalence of blindness and visual impairment is highest. As a result, the sample size can be smaller and the survey is faster and less expensive to carry out than traditional full-population surveys.7 RAAB software includes standardised and automatic data analysis and reporting. It generates four important cataract indicators (see panel below).
Equity of cataract services: disaggregating indicators
Cataract services are not used equally by people within countries. For example, in many settings high quality cataract surgery is provided to wealthy urban people, often before visual impairment occurs. In contrast, similar services are scarce or absent for the rural poor. If only wealthy urban people receive surgery, a high cataract surgical rate would not automatically mean that the coverage will be high or that the prevalence of cataract blindness will be low.
All cataract indicators can be disaggregated (reported separately) by gender, location (urban or rural), socioeconomic status, or disability, etc.10 When this is done, inequity is often identified. For example, women and rural dwellers tend to have lower cataract surgical coverage, a higher burden of cataract blindness, and worse postoperative visual outcomes than men and urban dwellers.11
Disaggregated cataract indicators are essential in order to understand the nature and extent of inequality in the population, to inform appropriate strategies to reduce inequality, and to monitor whether improvements in services (e.g. quality and access) are experienced by the groups who need them most. Cataract surgical outcome monitoring and RAAB software already present results separately for women and men. In future, disaggregation for other factors (e.g. socio-economic status) should become possible.
Interpreting cataract indicators
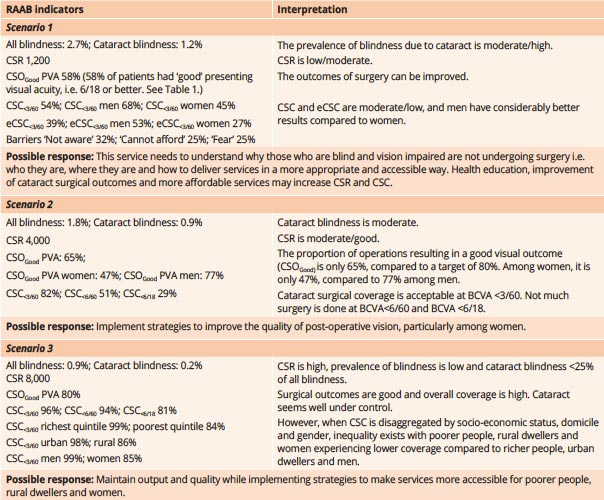
The current global action plan has chosen cataract surgical rate (CSR) and cataract surgical coverage(CSC) as its service delivery indicators, but a clearer picture of cataract services emerges when data are available for a broad range of indicators from both facility-based and population-based sources. Also, rather than considering just CSR and CSC in isolation, they should be considered in combination with other cataract and eye health indicators. For example, a high CSR alone may not reflect ‘good’ cataract services, without also considering the cataract surgical outcomes (CSO) of the operations, who was operated on (to ensure equity), and whether coverage (CSC and effective cataract surgical coverage, or eCSC) is improving. We have provided three scenarios in Table 2 below to demonstrate how helpful it can be to use a range of indicators to identify the specific aspect(s) of the service that require improvement.
Table 2 Three scenarios to illustrate the interpretation of various RAAB cataract indicators (for people aged 50 and over)
Conclusion
Cataract indicators and monitoring processes have evolved alongside cataract services over the past 30 years and will continue to do so in future. To be useful, indicators require good quality data and careful interpretation by clinicians and programme managers in order to identify which aspects of cataract services are most in need of being strengthened.
Summary of cataract indicators
| Facility-based data | Indicator | Aspect of service | Numerator and denominator |
|---|---|---|---|
| Cataract Surgical Rate* (/million population/year) | Efficiency | Number of cataract surgeries in a defined area in a year / Population in millions in same area | |
| Average output per cataract surgeon* | Efficiency | Number of cataract surgeries in a defined area in a year / Number of surgeons in same area | |
| Annual output per cataract surgeon* | Efficiency | Number of cataract surgeries by an individual surgeon in 12 months | |
| Cataract surgical outcome** (proportion: %) | Quality | Eyes after cataract surgery with post-op PVA/BCVA ≥6/18 (good) or <6/60 (poor) / All eyes after cataract surgery | |
| Surgical details** | Quality | Technique used, proportion and type of complication, major cause of poor outcome |
* calculated from logbooks / clinic database
** reported from surgical monitoring software
| Population-based data – for people aged 50 years and older only* | Indicator | Aspect of service | Numerator and denominator |
|---|---|---|---|
| Cataract blindness (VI) (prevalence: % and cases) | Burden | People with BCVA <3/60 (<6/60, <6/18) due to cataract / Population in survey area | |
| Incidence of cataract blindness** (VI) – (cases) | Burden | No. of new people who become blind (VI) with bilateral cataract within a population in a given time period (e.g. per year) | |
| Blindness and VI caused by cataract – (proportion: %) | Burden | People (eyes) blind and VI due to cataract in survey area / All people (eyes) blind and VI from all causes in survey area | |
| Cataract surgical coverage (proportion: %) | Access | People operated in 1 or both eyes / People operated in 1 or both eyes + people with bilateral cataract and BCVA<3/60, (<6/60, <6/18) | |
| Cataract surgical outcome (proportion: %) | Quality | Eyes after cataract surgery with post-op PVA/BCVA ≥6/18 (good) or <6/60 (poor) / All eyes after cataract surgery | |
| Effective cataract surgical coverage – (proportion: %) | Access + Quality | People operated in 1 or both eyes and PVA 6/18 or better in at least one operated eye / People operated in 1 or both eyes + people with bilateral cataract and BCVA<3/60, <6/60 or <6/18 | |
| Causes of poor surgical outcome – (proportion %) | Quality | Eyes with post-op. PVA <6/60 due to selection, surgery, spectacles or sequelae / All post-op. eye with PVA<6/60 | |
| Barriers to cataract surgery (proportion: %) | Access | Reasons for not being operated yet, by category and BCVA<6/18 (better eye) due to cataract / All reasons | |
| Surgical details | Place of surgery, type of surgery, costs |
* reported in RAAB (along with other indicators)
** calculated from RAAB data
Useful resources
Road Map for Scaling up Human Resources for Health: 2012–2025, WHO African Regional Office, 2013
Vision for Africa: Human Resources for Eye Health Strategic Plan: 2014–2023, IAPB Africa, 2014
WHO Global Health Workforce Alliance www.who.int/workforcealliance/en/
WHO, 2010. Increasing Access to Health Workers in Remote and Rural Areas Through Improved Retention: Global Policy Recommendations,
WHO, 2016. Public Financing for Health in Africa: from Abuja to the SDGs.
References
1 Foster A. VISION 2020: the cataract challenge. Comm Eye Health 2000;34(13):17-19.
2 Lewallen, S, Williams TD, Dray A, Stock BC, Mathenge W, Oye J, et al. Estimating incidence of vision-reducing cataract in Africa: A new model with implications for program targets. Arch. Ophthalmol. 128, no. 12 (2010): 1584.*
3 He M, Xu J, Li S, Wu K, Munoz SR, Ellwein LB. Visual acuity and quality of life in patients with cataract in Doumen County, China. Ophthalmol 1999; 106: 1609–15.
4 WHO Working Group, 1998. Informal consultation on analysis of prevention of blindness outcomes. Geneva, 1998. WHO/PBL/98.68
5 Limburg, Hans. Monitoring cataract surgical outcomes: methods and tools. Comm Eye Health 2002;44(15);51-53*
6 Gogate P, Vakil V, Khandekar R, Deshpande M, Limburg H. Monitoring and modernization to Improve visual outcomes of cataract surgery in a community eyecare center in Western India.” Journal of Cataract and Refractive Surgery 37, no. 2 (February 2011): 328–34.
7 Kuper H, Polack S Limburg L. Rapid Assessment of Avoidable Blindness. Comm Eye Health 2006;60(19):68-69.
8 Limburg, H, and A Foster. Cataract Surgical Coverage: An Indicator to Measure the Impact of Cataract Intervention Programmes. Community Eye Health / International Centre for Eye Health 11, no. 25 (1998): 3–6.*
9 Ramke, Jacqueline, Clare E. Gilbert, Arier C. Lee, Peter Ackland, Hans Limburg, and Allen Foster. Effective Cataract Surgical Coverage: An Indicator for Measuring Quality-of-Care in the Context of Universal Health Coverage. PLoS ONE 12, no. 3 (March 1, 2017). e0172342. doi:10.1371/journal.pone.017234*
10 Ramke J. Measuring inequalities in eye care: the first step towards change. Community Eye Health Journal 2016;29(93):6-7.
11 Ramke J, Zwi AB, Lee AC, Blignault I, Gilbert CE. Inequality in cataract blindness and services: moving beyond unidimensional analyses of social position Br J Ophthalmol 2017;101(4):395-400.